อุปกรณ์สนับสนุนการประหยัดพลังงาน
EcoWebServerIII - เซิร์ฟเวอร์รวบรวมข้อมูลการประหยัดพลังงาน
ให้การจัดการพลังงานเป็นหน้าที่ของ EcoWebServerIII
ด้วยการใช้อินทราเน็ตผ่านคอมพิวเตอร์ส่วนบุคคลทั่วไปกับ EcoWebServerIII ทำให้ EcoWebServerIII เป็น "ระบบการจัดการและทำให้มองเห็นการใช้พลังงาน" ที่หลากหลายและสนับสนุนกิจกรรมการประหยัดพลังงานของคุณ
แสดงกราฟข้อมูลบนเว็บเบราว์เซอร์
- สนับสนุนมาตรการประหยัดพลังงานในไลน์การผลิตด้วยแอปพลิเคชั่นในตัวที่เน้นการประหยัดพลังงาน (รวมถึงฟังก์ชั่นกราฟ)
- ด้วยฟังก์ชั่นเซิร์ฟเวอร์ HTTP ข้อมูลที่เก็บรวบรวมจะถูกส่งผ่านอีเธอร์เน็ตข้ามอินทราเน็ตเพื่อให้ทุกคนในเครือข่ายสามารถตรวจสอบและมองเห็นการใช้พลังงานในแบบเรียลไทม์
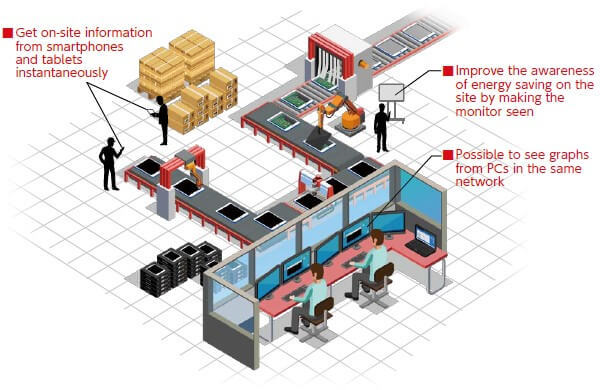
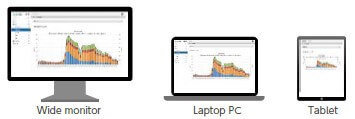
รองรับสมาร์ทโฟนและแท็บเล็ต
สามารถแสดงกราฟบนเว็บเบราว์เซอร์ดังนั้นคุณสามารถดูข้อมูลการใช้พลังงานบนสมาร์ทโฟนและแท็บเล็ต จึงทำให้สามารถเข้าถึงข้อมูลได้ทุกที่ ทุกเวลา
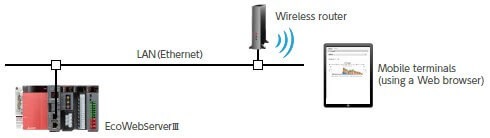
นอกจากนี้หน้าตาอินเตอร์เฟซจะปรับขนาดโดยอัตโนมัติ ขึ้นอยู่กับอุปกรณ์การแสดงผลที่ใช้
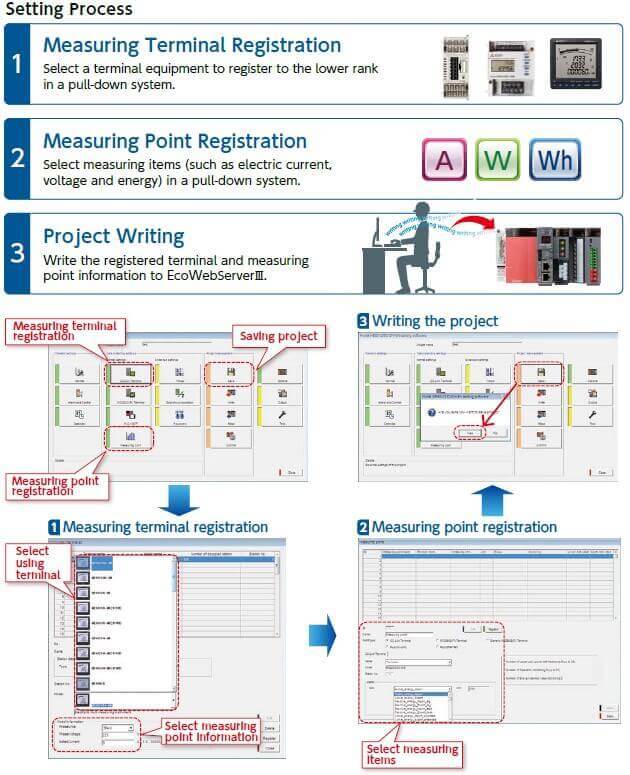
ตั้งค่าได้ง่าย (ลดการเขียนโปรแกรม)
การตั้งค่าที่จำเป็น มีดังนี้:

มีกราฟที่หลากหลายสำหรับการจัดการการประหยัดพลังงาน
มีเทมเพลตกราฟและฟังก์ชั่นที่หลากหลายอยู่ในตัว ดังนั้นจึงช่วยประหยัดเวลาที่ใช้ในการออกแบบ
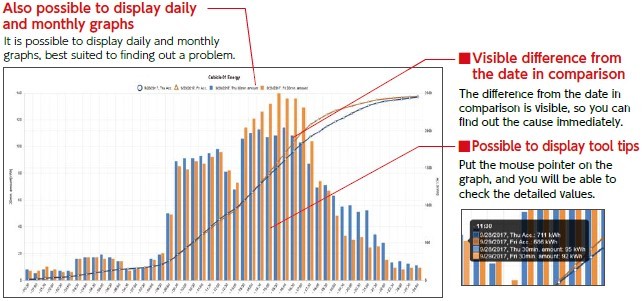
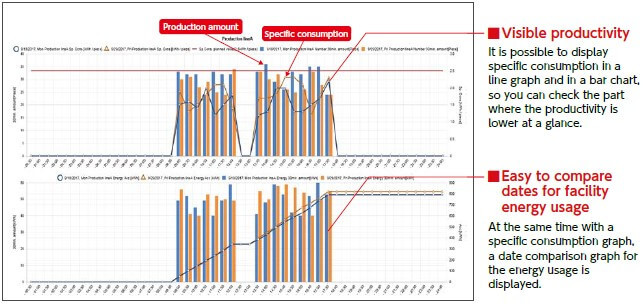
 กราฟเปรียบเทียบวันที่
สามารถเลือกรายการการวัดและวันที่เปรียบเทียบเพื่อแสดงกราฟได้ทันที
ทำให้คุณสามารถระบุค่าที่ผิดปกติและนำไปสู่การปรับปรุงการใช้พลังงานได้เป็นอย่างดี
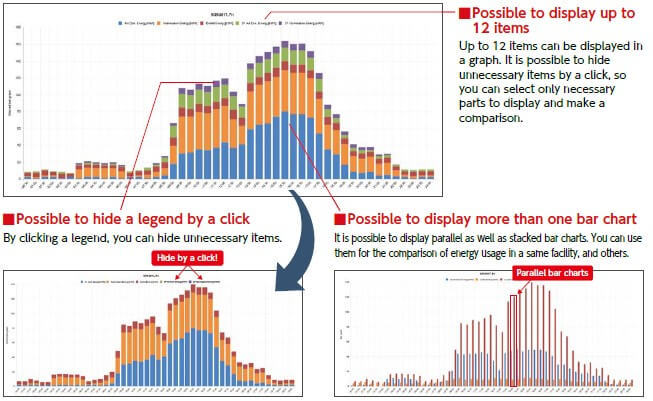
กราฟเปรียบเทียบจุดวัด
สามารถเลือกกลุ่มจุดตรวจวัดและวันที่เพื่อแสดงกราฟเปรียบเทียบจุดวัดได้ทันที
นอกจากนี้ยังสามารถระบุแผนกที่มีผลกระทบจากมาตรการประหยัดพลังงานซึ่งนำไปสู่กิจกรรมการประหยัดพลังงานที่มีประสิทธิภาพ
กราฟการใช้พลังงานเฉพาะจุด
สามารถตั้งค่าเพื่อแสดงกราฟการใช้พลังงานเฉพาะจุดและกราฟเปรียบเทียบวันที่ได้ทันที ซึ่งมีส่วนช่วยในการปรับปรุงประสิทธิภาพการผลิต
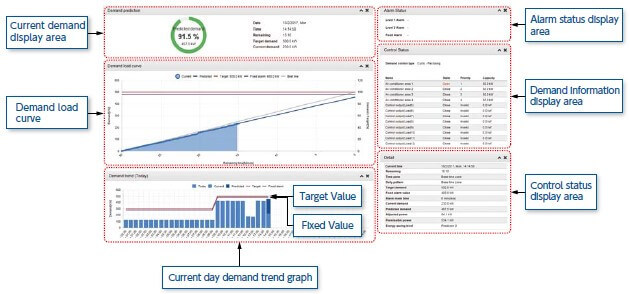
แสดงค่าค่าดีมานด์ (เฉพาะรุ่น MES3-255C-DM-EN)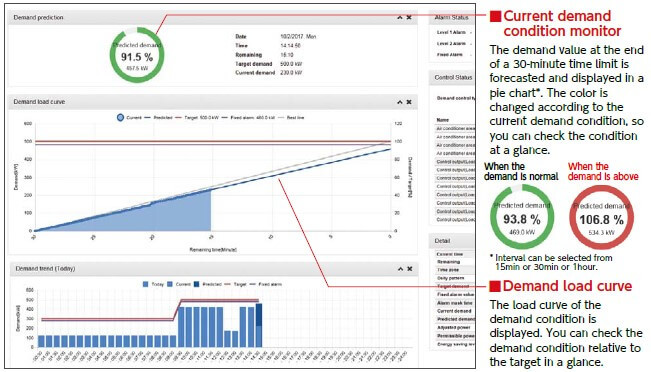
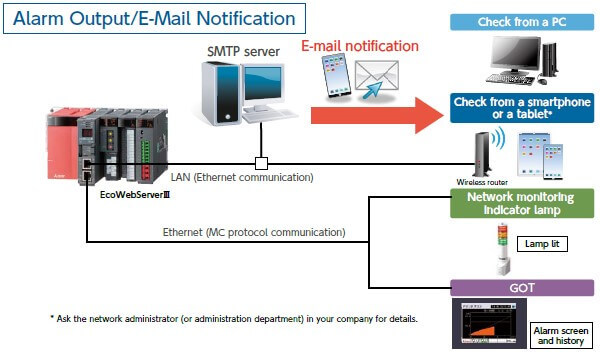
ตรวจหาส่วนเกินเป้าหมายและความผิดปกติของอุปกรณ์ทันทีโดยมีอีเมลแจ้งเตือน
- สามารถสร้างข้อความแจ้งเตือนในระบบและส่งอีเมลล์แจ้งเตือนในกรณีที่มีค่าเกินเป้าหมายที่ตั้งไว้หรือเมื่อตรวจพบความผิดปกติของอุปกรณ์ ทำให้สามารถทราบถึงสถานะและแก้ไขได้อย่างทันท่วงที นอกจากนีี้ยังสามารถเร่ง PDCA cycle เพื่อวัดผลและปรับปรุงการผลิต
- รองรับสมาร์ทโฟนและแท็บเล็ตจึงทำให้สามารถตรวจสอบระบบได้ที่หน้าไซต์งาน
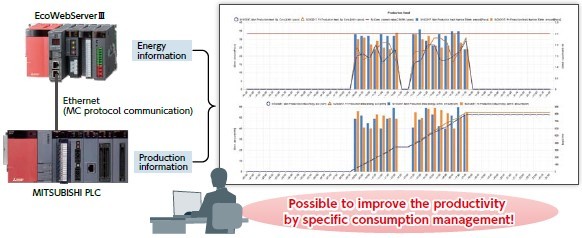
การจัดการปริมาณการใช้พลังงานเฉพาะจุดร่วมกับพีแอลซีของมิตซูบิชิ อีเล็คทริค
- ข้อมูลการผลิตที่ได้จากพีแอลซีของมิตซูบิชิ อีเล็คทริคและข้อมูลการใช้พลังงานของ EcoWebServerIII ทำให้สามารถจัดการการใช้พลังงานแบบเฉพาะจุดได้
- ซอฟต์แวร์การตั้งค่าเฉพาะของ EcoWebServerIII ช่วยให้สามารถอ่านข้อมูลพีแอลซีได้อย่างง่ายดาย
- สามารถปรับนโยบายการประหยัดพลังงานสำหรับแต่ละอุปกรณ์โดยพิจารณาจากข้อมูลการใช้พลังงานเฉพาะจุด
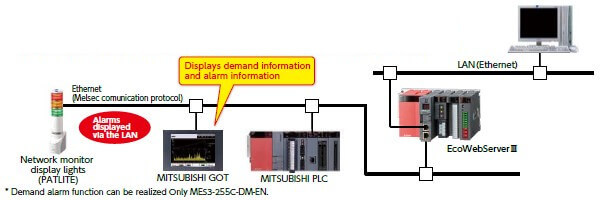
การเชื่อมต่อกับหน้าจอสั่งการระบบสัมผัส GOT ของมิตซูบิชิ อีเล็คทริค
สามารถแสดงข้อมูลที่รวบรวมใน EcoWebServerIII บนหน้าจอสั่งการระบบสัมผัส GOT ได้
ด้วยการแสดงสถานะการเตือนภัย จึงสามารถทราบถึงข้อมูลพลังงานและค่าดีมานด์แบบเรียลไทม์ที่ไซต์การผลิตซึ่งทำให้สามารถสร้างนโยบายการรับมือแบบเร่งด่วนได้
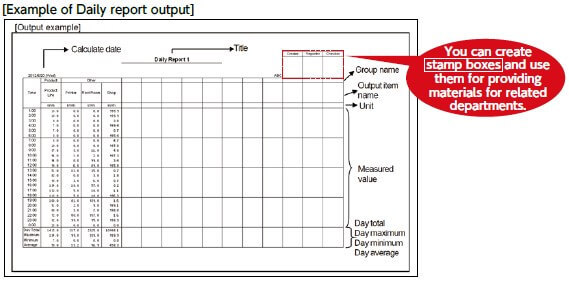
สร้างรายงานชนิดแยกประเภท (Ledgers)
EcoMeasureIII เป็นซอฟต์แวร์เฉพาะสำหรับการสร้างรายงานแบบรายวันและรายเดือน รวมไปถึงวิเคราะห์การใช้พลังงาน (แยกจำหน่าย) ซึ่งทำให้สามารถสร้างรูปแบบแยกประเภทสำหรับรายงานแบบรายวัน รายเดือนและรายปีด้วยไฟล์ CSV ที่บันทึกอัตโนมัติโดย EcoWebServerIII
ด้วยฟังก์ชัน master ledger จะทำให้สามารถปรับแต่งรูปแบบรายงานได้
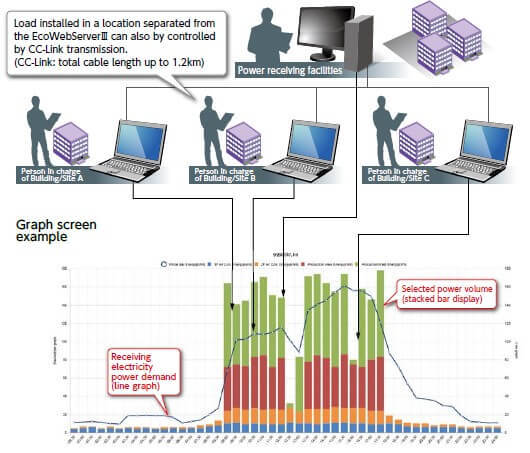
สามารถดูแนวโน้มค่าดีมานด์และการใช้พลังงานของแต่ละอุปกรณ์/ ตึก
*เฉพาะรุ่น MES3-255C-DM-EN
สามารถดูค่าดีมานด์ของพลังงาน (สมดุลโหลด) ได้อย่างง่ายดายจากแนวโน้มค่าดีมานด์และกราฟแท่งของแต่ละสถานีย่อยหรืออุปกรณ์ ช่วยให้สามารถวางแผนการดำเนินงานได้อย่างมีประสิทธิภาพโดยพิจารณาจากค่าการวิเคราะห์ รวมไปถึงค่า peak shift/peak cut.
หน้าจอแสดงค่าดีมานด์
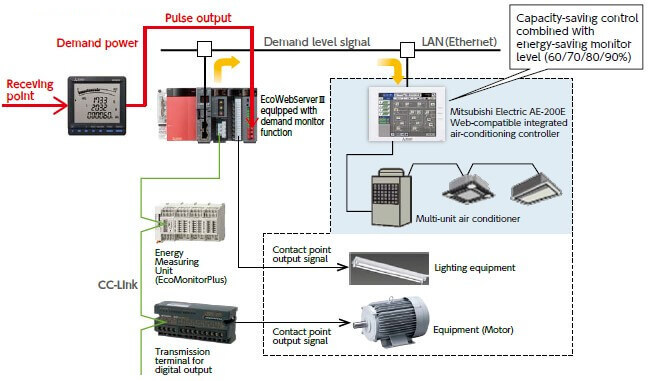
ประหยัดการใช้พลังงานของเครื่องปรับอากาศได้ด้วยฟังก์ชันการควบคุมเครื่องปรับอากาศในตัว
* เฉพาะรุ่น MES3-255C-DM-EN
ควบคุมค่าดีมานด์ได้โดยการเชื่อมต่อกับคอนโทรลเลอร์ชนิด Web-compatible integrated ของมิตซูบิชิ อีเล็คทริค รุ่น "AE-200E" หรือ "G-150AD" นอกจากนี้ EcoWebServerIII ยังสามารถควบคุมโหลดแบบอัตโนมัติผ่านการสื่อสารแบบ CC-Link.
ฟังก์ชันจุดวัดเสมือน
- จุดตรวจวัดเสมือน หมายถึง จุดตรวจวัดที่ใช้ผลการคำนวณระหว่างจุดตรวจวัดเป็นข้อมูลการวัดแบบเสมือน สามารถลงทะเบียนจุดวัดได้สูงสุด 128 จุด (ไม่รวมจุดวัดปกติ 255 จุด)
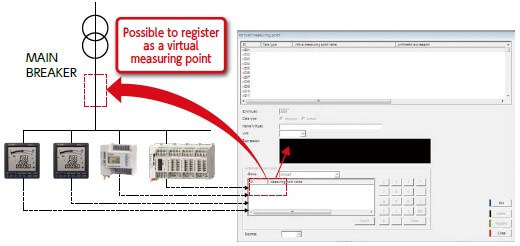
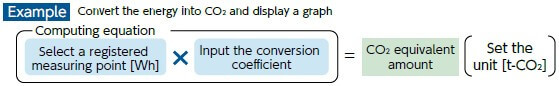
- สามารถแปลงเป็นปริมาณการใช้ CO2 หรือค่าไฟฟ้า ด้วยการป้อนค่าสมการคำนวณข้อมูลการวัด/ การป้อนค่าด้วยตนเอง หรือการเลือกจากรายการ
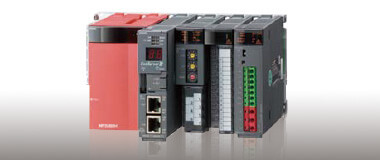
เซิร์ฟเวอร์รวบรวมข้อมูลการประหยัดพลังงาน
รุ่น: MES3-255C-EN
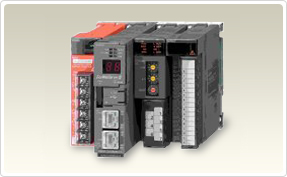
เซิร์ฟเวอร์รวบรวมข้อมูลการประหยัดพลังงาน
(รองรับฟังก์ชันการควบคุมค่าดีมานด์)
รุ่น: MES3-255C-DM-EN